How do you measure cycling in London, and its growth over time? The answers to these questions aren’t just interesting in themselves – they’re also important for measuring whether cycling is getting more or less safe. Unfortunately there’s no perfect way to measure the number of people cycling or the distance they cover, but there are a few decent attempts, which this post will describe.
One measure we hear mentioned a lot is Transport for London’s count of the number of cyclists on its network of main roads, the TLRN. The chart below, from a previous post, shows the quarterly trend since 2000. On an annualised basis this shows an increase of about 150% over ten years.
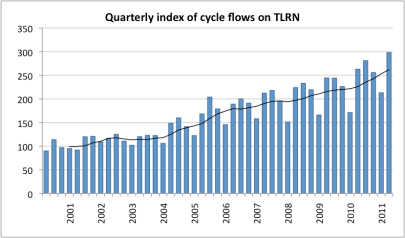
The good thing about this data is that it’s available quarterly and TfL keep it pretty up to date. The drawback is that it only covers a small subset of London’s roads. The map below shows all the TLRN count sites TfL use to measure this flow.

The Department for Transport do their own counts of road traffic in London and elsewhere, in order to construct estimates of the distance travelled by each mode in each region in a given year. They survey a huge number of roads, but only once a year for main road sites (of which there are nearly two thousand in London) and less than annually for minor roads. Here’s what the trend in DfT’s count of cyclists on major roads looks like in London. According to these figures cycling on major roads in London increased by ‘only’ 78% between 2000 and 2009, much less than the TLRN count would indicate.

As mentioned above, DfT use these figures to calculate the distance travelled by each mode. The resulting trend for cycling in London is shown below. This trend is even flatter, showing an increase of only 38% between 2000 and 2010. The reason seems to be that most of the growth in cycling flows has been seen in areas where the count sites are more closely packed together so each extra cyclist counted translates into only a small increase in distance travelled (see DfT’s note on how traffic counts are turned into distance travelled).

Lastly, we go back to TfL, who in their third Travel in London report recognise the issues with the simple TLRN count and come up with a new way to estimate the number of cycling ‘journey stages’ in London on a typical day. Using data from their TLRN counts, the DfT counts and from their London Travel Demand Survey they estimate that cycling journey stages increased by 61 per cent between 2001 and 2009 (see p. 56 here).
So what you’re left with is a range of different ways of counting how much cycling there is in London, each of which produces a very different figure for the amount of growth in the last decade or so, from 38% to about 150%. Which one you use has important consequences, most notably for deciding whether the accident rate (per trip or per km) is rising or falling in London. This report from TfL says:
Comparing 2010 with 2009, total pedal cycle casualties rose by nine per cent (from 3,669 to 4,007), while the number of cycle journeys increased at a faster rate, by 15 per cent, indicating that cycling is becoming relatively safer.
But that 15% figure refers to the TLRN count, so comparing it to the London-wide casualty total is not comparing like with like. Every other measure, including TfL’s own measure of journey stages, shows slower growth. DfT calculate their own statistics on casualties per 100 million kilometres, and they show an increasing cycle casualty rate in recent years – see this recent post at Cyclists in the City for the trend, and for the raw data go here for 2010 and for previous years table 2.5a in each edition here.
In summary then, measuring how cycling has grown over time is very important, but it’s also very difficult. It’s vital to keep in mind how the different measures are constructed and what they mean if the right conclusions are to be drawn.
Filed under: Cycling, Data, DfT, Historic, London, Modal share, TfL


